Law 25 · Instruction & Output
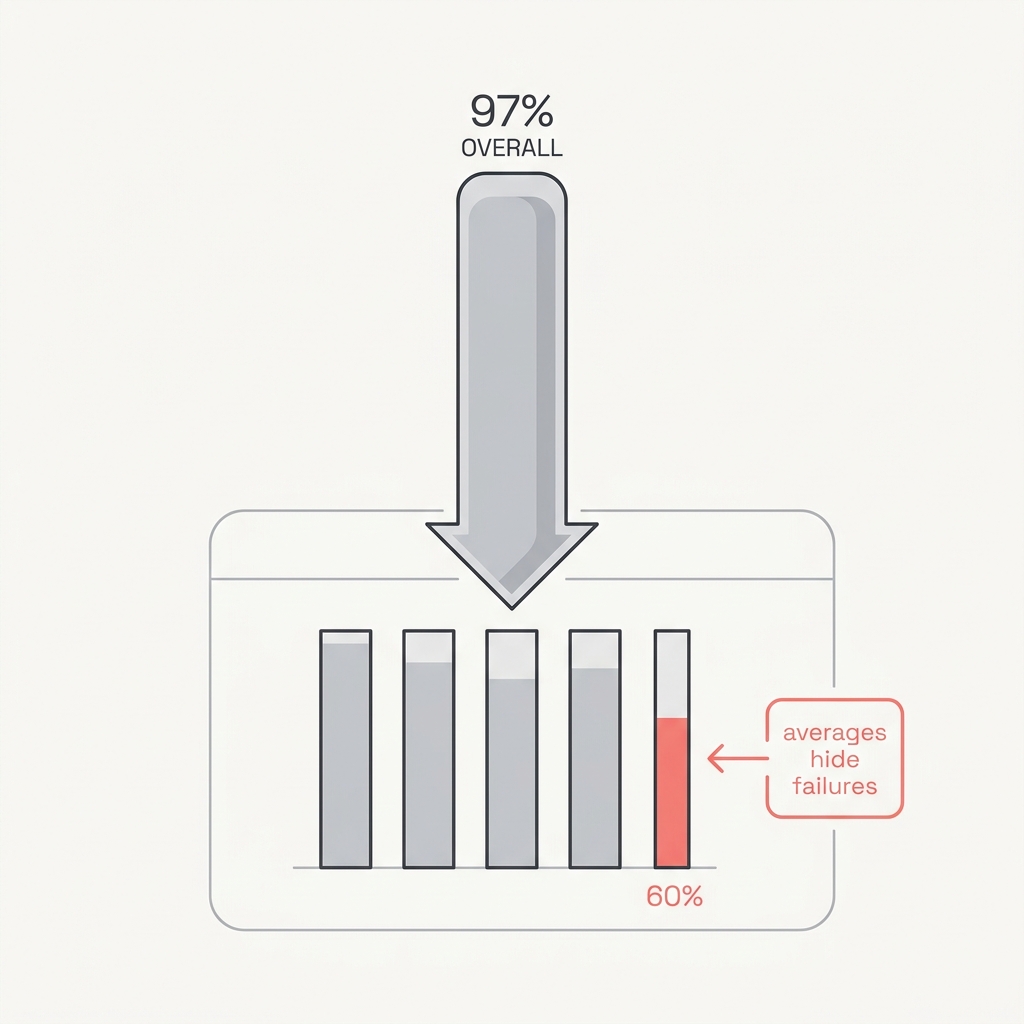
Averages Lie
97% overall can hide a 60% segment.
The principle
An aggregate metric is a blended story that smooths over exactly the failures you most need to see. A system at 97% overall can be 99% on easy cases and 60% on the rare, hard segment where errors actually cluster. Trust the headline and you'll automate straight into the cracks it's hiding.
Why it happens
A single aggregate metric is a weighted average over a heterogeneous population, so a high headline number is mathematically consistent with catastrophic failure on any small subgroup: 99% on a 90%-of-traffic easy segment and 60% on a rare 10% segment still averages to roughly 96%. The discipline of disaggregated evaluation, computing the metric separately per slice, exists precisely because equal-looking overall performance can hide large disparities that only appear once you condition on type, segment, or field. Errors are rarely uniform; they cluster in the rare and hard cases, which are exactly the rows an average dilutes into invisibility. Random sampling compounds the blind spot, because the high-stakes segment is by definition underrepresented and may never appear in a small random draw.
Watch for
- You are deciding to ship or automate based on one overall accuracy or pass-rate number.
- Your evaluation set is sampled randomly, so rare high-stakes cases barely appear in it.
- You cannot say how the system performs on your worst segment because you have never measured it separately.
In practice
Your support-triage classifier reports 96% accuracy and the team greenlights auto-routing. Three weeks in, the billing-dispute queue is a disaster, because the model was 99% accurate on the common 'password reset' and 'where is my order' tickets and 58% on the rare refund-dispute segment where mistakes actually cost you customers. The blended number hid the exact slice you most needed to see. Slice the eval by ticket type, intent, and language before you trust it, and oversample the rare high-stakes cases instead of grading on a random draw.
Apply it
- Break performance down by type, segment, and field, and require every slice to clear the bar, not just the average.
- Oversample rare and high-stakes cases deliberately instead of relying on a random draw.
- Treat any slice that falls below threshold as a blocker even when the headline number looks healthy.
The takeaway
Slice before you trust. Break performance down by type, segment, and field, and require every slice to clear the bar before you act on the average. Sample deliberately for the rare cases, not just randomly.